Reduce LED Noise and Distortion for Accurate Pulse Oximetry
Bijgedragen door De Noord-Amerikaanse redacteurs van DigiKey
2019-01-16

This article discusses the electronic blocks of a typical pulse oximeter before introducing appropriate LED drive solutions and their application toward the design of a low-noise, low-distortion LED drive circuit.
Pulse oximeter electronics

(Bron afbeelding: Bonnie Baker)
LED driver circuit

![]()
Where D = DAC register, the decimal data word, and N = number of DAC bits.
![]()
LED driver noise analysis
- The DAC’s integral and differential nonlinearity
- The voltage reference’s 1/f noise and the amplifier’s 1/f noise
- The amplifier’s common-mode distortion
These noise sources are worth a closer look.


(Bron afbeelding: Analog Devices)
From the Figure 4 and Figure 5 nonlinearity graphs, the maximum analog noise can be one-third of the worst-case nonlinearity, or 0.6 LSB which equals:
![]()
![]()
Using Equation 3, the total 1/f noise going into the DAC REFF pin is:
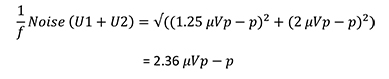
The noise for the voltage reference (U1) and the buffer amplifier (U2) is markedly smaller than the DAC’s LSB size.

(Bron afbeelding: Bonnie Baker)

(Bron afbeelding: Analog Devices)
Noise measurements
-
- 16-bit DAC
-
- 2.5 volt output reference
-
- Zero common-mode crossover distortion
-
- Zero common-mode crossover distortion
The actual noise measurement of this circuit is done using a noise measuring box with a gain of 10,000 V/V combined with a 0.1 Hz to 10 Hz filter (Figure 8).

(Bron afbeelding: Analog Devices)


(Bron afbeelding: Analog Devices)
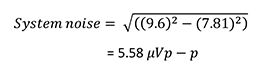
The uncorrelated noise from the two systems combines with the RSS formula to give:

(Bron afbeelding: Analog Devices)
Conclusie
Disclaimer: The opinions, beliefs, and viewpoints expressed by the various authors and/or forum participants on this website do not necessarily reflect the opinions, beliefs, and viewpoints of DigiKey or official policies of DigiKey.